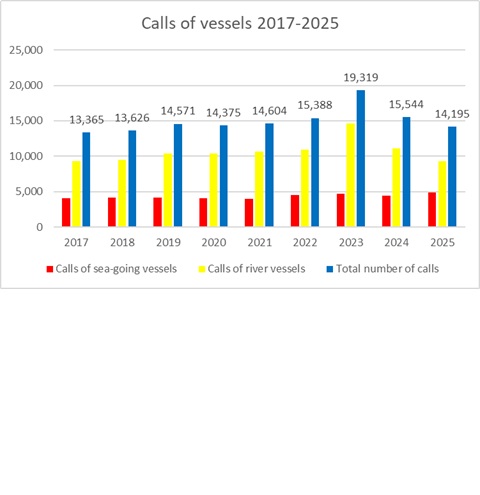
| Traffic figures | Year 2017 | Year 2018 | Year 2019 | Year 2020 | Year 2021 | Year 2022 | Year 2023 | Year 2024 | Year 2025 |
|---|---|---|---|---|---|---|---|---|---|
| Total Traffic (tonnes) | 58,379,154 | 61,303,774 | 66,603,292 | 60,375,799 | 67,483,435 | 75,537,687 | 92,693,915 | 77,537,345 | 67,578,279 |
| Bulk cargo (tonnes) | |||||||||
| Liquid bulk | 13,354,280 | 14,022,558 | 14,920,635 | 12,425,658 | 12,821,712 | 18,001,109 | 18,801,715 | 19,603,526 | 17,426,878 |
| Dry bulk | 34,853,978 | 37,192,770 | 41,583,345 | 38,580,780 | 44,562,451 | 44,831,522 | 59,512,521 | 43,042,255 | 36,876,325 |
| General cargo (tonnes) | 3,646,803 | 3,524,788 | 3,546,879 | 3,023,669 | 3,915,944 | 4,783,304 | 4,281,333 | 4,344,016 | 5,437,035 |
| Containers | |||||||||
| Gross Weight(tonnes) | 6,524,093 | 6,563,658 | 6,552,433 | 6,345,692 | 6,183,913 | 7,921,752 | 10,098,346 | 10,547,547 | 7,838,041 |
| Number | 413,253 | 400,832 | 400,945 | 389,061 | 379,139 | 460,506 | 548,121 | 592,284 | 491,264 |
| TEU | 696,438 | 668,016 | 666,036 | 643,725 | 631,946 | 776,590 | 884,598 | 989,795 | 831,131 |
| Sea-going vessels | 4,093 | 4,139 | 4,176 | 4,031 | 3,985 | 4,498 | 4,705 | 4,459 | 4,852 |
| River vessels | 9,272 | 9,487 | 10,395 | 10,344 | 10,619 | 10,890 | 14,614 | 11,085 | 9,343 |
| Cargo type | Year 2017 tonnes |
Year 2018 tonnes |
Year 2019 tonnes |
Year 2020 tonnes |
Year 2021 tonnes |
Year 2022 tonnes |
Year 2023 tonnes |
Year 2024 tonnes |
Year 2025 tonnes |
|---|---|---|---|---|---|---|---|---|---|
| Cellulose and waste paper | 39,089 | 28,274 | 48,801 | 73,340 | 58,992 | 30,490 | 72,539 | 91,334 | 139,618 |
| Cement, lime, prefabricated materials for constructions | 165,702 | 205,712 | 363,850 | 703,119 | 814,793 | 620,894 | 570,647 | 640,491 | 1,508,152 |
| Cereals | 17,891,285 | 17,963,535 | 21,329,156 | 21,893,550 | 25,174,619 | 24,010,975 | 36,227,058 | 26,964,277 | 18,335,255 |
| Chemical products from coal and tar | 153,372 | 167,805 | 102,722 | 110,015 | 90,339 | 124,405 | 119,028 | 113,842 | 71,353 |
| Solid mineral fuels | 2,830,470 | 3,770,447 | 3,834,946 | 2,850,701 | 3,438,621 | 3,481,817 | 3,109,573 | 2,130,077 | 2,855,590 |
| Crude oil | 7,352,164 | 7,475,408 | 8,027,409 | 6,638,429 | 6,715,111 | 9,512,520 | 7,698,319 | 9,098,103 | 9,068,533 |
| Food stuff and animal feed | 504,549 | 167,256 | 349,544 | 286,356 | 321,015 | 308,465 | 344,420 | 126,456 | 119,035 |
| Glassware and ceramic products | 17,679 | 27,056 | 11,755 | 5,089 | 2,930 | 0 | 0 | 23,382 | 61,624 |
| Iron ores, scrap | 3,924,125 | 4,521,893 | 5,189,807 | 3,868,790 | 4,766,262 | 7,002,094 | 7,752,287 | 4,405,721 | 3,303,841 |
| Leather, textiles, clothes and other manufactured products | 553 | 3,344 | 1,608 | 0 | 0 | 24,118 | 0 | 0 | 1 |
| Livestock, sugar beet | 97,738 | 70,934 | 96,399 | 100,433 | 113,527 | 93,085 | 84,106 | 82,459 | 100,426 |
| Machines, transport equipments | 337,910 | 535,331 | 376,115 | 441,600 | 433,666 | 464,448 | 423,345 | 940,275 | 1,192,498 |
| Metal products | 2,217,403 | 2,287,151 | 2,529,108 | 1,953,551 | 2,502,520 | 3,225,583 | 2,816,107 | 2,688,840 | 3,320,713 |
| Metalware | 5,263 | 8,019 | 10,900 | 1,898 | 8,916 | 7,624 | 6,775 | 28 | 1,100 |
| Miscellaneous | 6,525,662 | 6,567,347 | 6,561,433 | 6,348,655 | 6,197,408 | 7,940,143 | 10,112,932 | 10,551,875 | 7,841,382 |
| Natural and chemical fertilizers | 3,094,332 | 3,007,574 | 4,024,682 | 4,420,218 | 4,103,372 | 4,507,272 | 4,978,016 | 5,303,374 | 5,595,345 |
| Non-ferrous ores and scrap | 3,111,182 | 3,976,068 | 3,861,530 | 2,276,486 | 3,150,187 | 953,943 | 426,153 | 724,037 | 796,677 |
| Oil products | 5,473,279 | 5,897,915 | 6,296,060 | 5,042,322 | 5,438,743 | 7,202,140 | 7,529,705 | 8,851,648 | 7,875,475 |
| Oil seeds, oleaginous fruits and fats | 3,215,811 | 3,262,034 | 2,141,252 | 1,826,407 | 2,204,820 | 3,740,834 | 9,275,148 | 3,287,841 | 3,734,962 |
| Other chemical products | 559,649 | 590,365 | 537,533 | 713,346 | 642,977 | 676,993 | 409,041 | 464,342 | 407,853 |
| Potatoes, other fresh or frozen fruits and vegetable | 6,913 | 7,289 | 3,227 | 0 | 0 | 0 | 3,024 | 0 | 5,034 |
| Raw or processed minerals | 438,273 | 448,322 | 615,906 | 594,396 | 892,854 | 1,223,515 | 564,545 | 855,297 | 1,007,960 |
| Wood and cork | 416,751 | 314,695 | 289,549 | 227,098 | 411,763 | 386,329 | 171,147 | 193,646 | 235,851 |
| Total | 58,379,154 | 61,303,774 | 66,603,292 | 60,375,799 | 67,483,435 | 75,537,687 | 92,693,915 | 77,537,345 | 67,578,279 |
| Ship Type | 2017 | 2018 | 2019 | 2020 | 2021 | 2022 | 2023 | 2024 | 2025 |
|---|---|---|---|---|---|---|---|---|---|
| No. of calls | No. of calls | No. of calls | No. of calls | No. of calls | No. of calls | No. of calls | No. of calls | No. of calls | |
| Cargo | 1,815 | 1,785 | 1,807 | 1,927 | 1,751 | 1,969 | 1,883 | 1,818 | 2,042 |
| Passenger | 13 | 11 | 17 | 0 | 3 | 16 | 32 | 54 | 38 |
| Portcontainer | 592 | 524 | 510 | 475 | 494 | 435 | 477 | 523 | 467 |
| Tank | 608 | 670 | 687 | 581 | 587 | 798 | 750 | 711 | 596 |
| Bulk Carrier | 574 | 628 | 622 | 558 | 645 | 741 | 1000 | 687 | 643 |
| Others | 491 | 521 | 533 | 490 | 505 | 539 | 563 | 666 | 1,066 |
| Total | 4,093 | 4,139 | 4,176 | 4,031 | 3,985 | 4,498 | 4,705 | 4,459 | 4,852 |
| Capacity | 2017 | 2018 | 2019 | 2020 | 2021 | 2022 | 2023 | 2024 | 2025 |
|---|---|---|---|---|---|---|---|---|---|
| No. of calls | No. of calls | No. of calls | No. of calls | No. of calls | No. of calls | No. of calls | No. of calls | No. of calls | |
| up to 5,000 | 1,577 | 1,557 | 1,515 | 1,925 | 910 | 1,039 | 1,053 | 1,098 | 1,195 |
| 5,001-10,000 | 504 | 495 | 529 | 601 | 874 | 1,105 | 992 | 1,061 | 992 |
| 10,001-20,000 | 545 | 534 | 453 | 406 | 348 | 440 | 524 | 390 | 479 |
| 20,001 - 45,000 | 556 | 616 | 705 | 808 | 673 | 765 | 931 | 807 | 670 |
| 45,001-90,000 | 65 | 46 | 59 | 102 | 380 | 367 | 474 | 372 | 363 |
| 90,001-180,000 | 123 | 128 | 124 | 74 | 91 | 95 | 103 | 104 | 71 |
| >180,000 | 0 | 0 | 0 | 0 | 0 | 7 | 9 | 5 | 2 |
| Total | 3,370 | 3,376 | 3,385 | 3,916 | 3,276 | 3,818 | 4,086 | 3,837 | 3,772 |
| Capacity | 2017 | 2018 | 2019 | 2020 | 2021 | 2022 | 2023 | 2024 | 2025 |
|---|---|---|---|---|---|---|---|---|---|
| No. of calls | No. of calls | No. of calls | No. of calls | No. of calls | No. of calls | No. of calls | No. of calls | No. of calls | |
| up to 5,000 | 43 | 89 | 87 | 84 | 79 | 69 | 68 | 87 | 63 |
| 5,001 - 10,000 | 11 | 2 | 7 | 13 | 15 | 12 | 31 | 37 | 40 |
| 10,001 - 20,000 | 0 | 1 | 0 | 0 | 1 | 0 | 0 | 0 | 6 |
| 20,001 - 45,000 | 3 | 17 | 5 | 1 | 3 | 1 | 2 | 1 | 6 |
| 45,001 - 90,000 | 8 | 5 | 7 | 6 | 0 | 1 | 3 | 1 | 0 |
| 90,001 - 180,000 | 6 | 1 | 1 | 2 | 11 | 7 | 5 | 4 | 0 |
| Total | 71 | 115 | 107 | 106 | 109 | 90 | 109 | 130 | 115 |
| Capacity | 2017 | 2018 | 2019 | 2020 | 2021 | 2022 | 2023 | 2024 | 2025 |
|---|---|---|---|---|---|---|---|---|---|
| No. of calls | No. of calls | No. of calls | No. of calls | No. of calls | No. of calls | No. of calls | No. of calls | No. of calls | |
| up to 5,000 | 378 | 359 | 382 | 4 | 273 | 264 | 240 | 221 | 634 |
| 5,001 - 10,000 | 116 | 126 | 147 | 3 | 184 | 216 | 190 | 209 | 261 |
| 10,001 - 20,000 | 39 | 33 | 44 | 0 | 27 | 41 | 29 | 18 | 28 |
| 20,001 - 45,000 | 67 | 70 | 47 | 0 | 67 | 42 | 51 | 40 | 48 |
| 45,001 - 90,000 | 44 | 56 | 61 | 2 | 11 | 13 | 7 | 6 | 3 |
| 90,001 - 180,000 | 8 | 4 | 3 | 0 | 38 | 56 | 55 | 48 | 63 |
| Total | 652 | 648 | 684 | 9 | 600 | 632 | 572 | 542 | 1,037 |
* Taking into account that Constanța Port includes the zones of Constanța, Midia and Mangalia, the number of calls for the entire port differs from the total number of calls for each of the zones, because there are cases when a ship calls at 2 zones of the port during the same call.
| Ship Type | 2017 | 2018 | 2019 | 2020 | 2021 | 2022 | 2023 | 2024 | 2025 |
|---|---|---|---|---|---|---|---|---|---|
| No. of calls | No. of calls | No. of calls | No. of calls | No. of calls | No. of calls | No. of calls | No. of calls | No. of calls | |
| Tug-boat | 30 | 43 | 40 | 30 | 12 | 35 | 89 | 65 | 35 |
| Tank (self-propelled) | 442 | 398 | 286 | 257 | 382 | 675 | 1,033 | 969 | 875 |
| Barge | 5,603 | 5,966 | 6,514 | 6,578 | 6,690 | 6,694 | 8,128 | 5,851 | 4,963 |
| Flatboat (non-propelled) | 741 | 595 | 559 | 487 | 402 | 354 | 420 | 275 | 319 |
| Pusher | 1,292 | 1,328 | 1,468 | 1,341 | 1,401 | 1,415 | 1,584 | 1,287 | 1,296 |
| Barge - tank | 103 | 150 | 264 | 198 | 194 | 261 | 278 | 283 | 265 |
| Fluvial barge (self-propelled) | 1,044 | 998 | 1,254 | 1,432 | 1,498 | 1,427 | 3,074 | 2,344 | 1,557 |
| Others | 17 | 9 | 10 | 21 | 40 | 29 | 8 | 11 | 33 |
| Total | 9,272 | 9,487 | 10,395 | 10,344 | 10,619 | 10,890 | 14,614 | 11,085 | 9,343 |